
July 2015 marked the 25th anniversary of the Americans with Disabilities Act. The Centers for Disease Control and Prevention (CDC) recognized the event by releasing a study on disabled adults. For the first time, we have access to disability data that includes additional demographic filtering. The new data also provides more information about types of disability. New insights are revealed and others reinforced. The study canvased only people living independently. The data does not include individuals residing in nursing home or assisted living facilities, making it particularly pertinent to the working population.
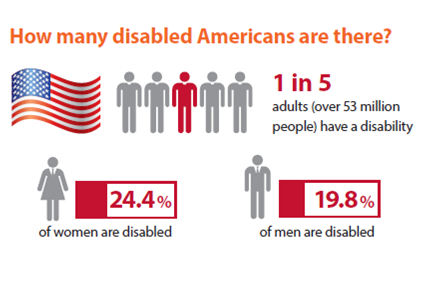
The main takeaway: Disability isn’t something that only happens to other people. One in five adults, 22.2 percent, report having a disability. Statistically, it’s happening to your family members and your neighbors … and it could happen to you.
Read key highlights below, and download our “Face of Disability” infographic to share with your clients. It will help paint a clearer picture of the reality of disability in America.
- Gender: One in five adults, 22.2 percent, report having a disability. On a percentage basis, more women, 24 percent, report being disabled compared with 19 percent of men although looking at pure numbers, more men are disabled than women.
- Geography: The geographic patterns reveal southern states, Alabama, Mississippi, Tennessee, and Arkansas all have 30 percent or more of the population reporting as being disabled. The upper-Midwest, Minnesota (16.4) and North Dakota (16.5) report the lowest percentage of disabled adults.
- Economics: More than 82 percent of disabled adults are unable to work. It’s not surprising that household income levels are lowest among this segment of disabled adults, with the majority claiming income less than $15,000 annually. An under-educated pattern also emerges from this new data; 38.8 – 40.8 percent of respondents have less than an high school education.
- Causes: Most of the stated disabilities were due to loss of mobility. Musculoskeletal conditions such as arthritis, back complaints, and spine problems are cited most often. Mobility issues were much higher, more than three times, in adults age 45 – 64 than those age 18 – 44. Loss of cognition, the second most common disability type overall, was the highest disability cited by the younger disabled population.

Share this Image On Your Site
Use the Face of Disability infographic and our Stat Pack infographic in tandem to the risks and realities of disability. And, to help get prepared for disability insurance sales conversations, download our two most popular sales scripts: The Wealth Preservation Plan and The Business Bonus Pack. Don’t have time to make the sale yourself? Make it happen anyway with our all-new Sales Concierge Program.